2026-09-30 · 5 min read
7 Live Traffic Patterns and What They Actually Mean for Your Website
Learn to read your live visitor data. Seven common real-time traffic patterns, what causes each one, and exactly what to do when you see them. Tags: live traffic, real-time analytics, traffic spikes, visitor behavior, website monitoring
7 Live Traffic Patterns and What They Actually Mean for Your Website
Opening a real-time dashboard for the first time can feel like watching a heart monitor. Numbers rise and fall, pages appear and disappear, and it isn't obvious which movements matter. The good news is that live traffic follows a small number of recurring patterns. Once you recognize them, a glance at your dashboard tells you what is happening and what to do next.
Here are seven patterns worth knowing.
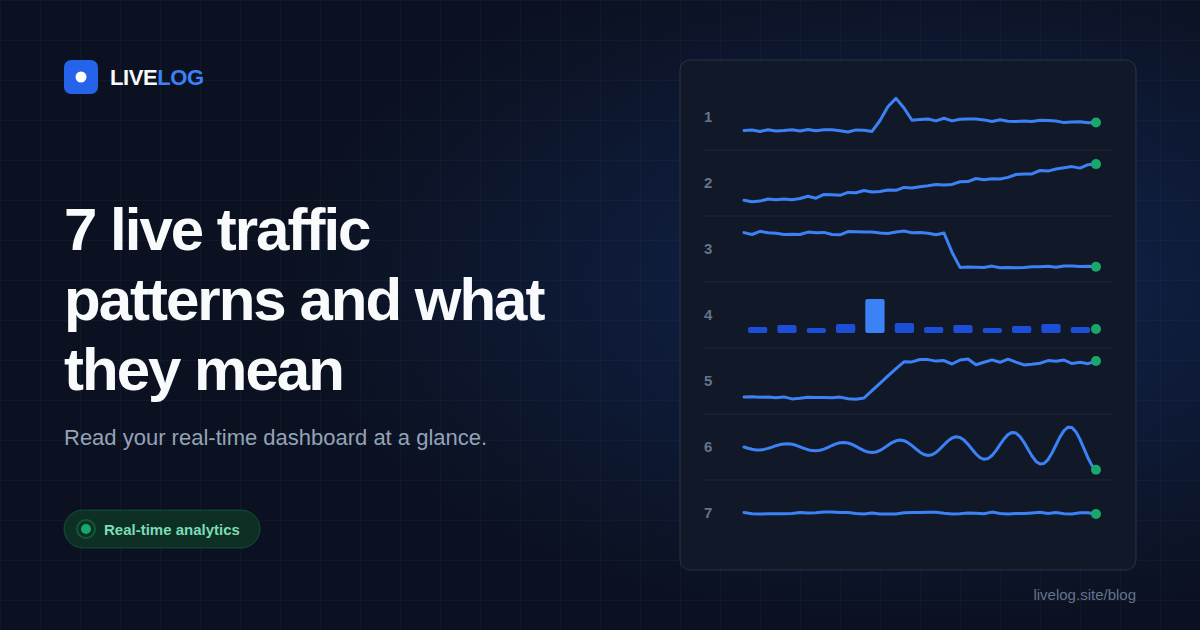
1. The sudden spike
What it looks like: Live visitors jump sharply within minutes, often concentrated on a single page.
Common causes: A social media share, a mention on a popular site, a newsletter send, or a link posted in a community.
What to do: Check the referrer first, because it tells you where the attention is coming from. Then look at the page receiving the traffic. A spike is the best moment to make sure that page has a clear next step, such as a link to related content or a signup button. If the source is a community or social platform, consider replying there while the conversation is active.
2. The slow climb
What it looks like: Visitors increase gradually over hours, without a dramatic jump.
Common causes: Search engines starting to rank a page, a campaign building momentum, or a time zone waking up.
What to do: Slow climbs are usually healthy and sustainable. Note which page is growing and what it targets, since that is a signal about what your audience is searching for. If it happens repeatedly at the same time each day, you have found your audience's active hours.
3. The sudden drop
What it looks like: Live visitors fall off sharply and stay low.
Common causes: A site outage, a broken deployment, an expired certificate, a misconfigured redirect, or a marketing campaign ending.
What to do: Treat this as a check-your-site moment. Open your homepage and a few key pages in a private browser window. If they load, look at recent changes such as new code, plugins or settings. Real-time data lets you catch this in minutes rather than the next morning.
4. The single-page cluster
What it looks like: Most current visitors are on one page, while the rest of the site is quiet.
Common causes: A page shared externally, a page ranking for a popular search, or a link in an email or advertisement.
What to do: This page is doing you a favor, so make it work harder. Add internal links to related pages, make sure the page loads quickly, and check that the call to action is visible without scrolling far.
5. The mobile flood
What it looks like: The device breakdown shifts heavily toward phones, usually alongside a traffic spike.
Common causes: Social platforms, messaging apps and short links, which are mostly opened on mobile devices.
What to do: Open your live page on a phone. Check text size, button spacing, image loading and whether any popups cover the content. A page that looks fine on a desktop can frustrate a mobile crowd.
6. The one-country surge
What it looks like: A large share of current visitors come from a single country you don't usually see.
Common causes: A mention in a local publication, a language-specific social post, a regional holiday, or in some cases automated traffic.
What to do: If the visitors are viewing real content and moving between pages, it is likely genuine interest, and you might consider adding content in their language or relevant to their region. If the visits are all on one page with no other activity, be cautious about drawing conclusions and watch whether the pattern continues.
7. The steady flatline
What it looks like: Live visitors hold at a low, constant number with little variation.
Common causes: Small or new sites, niche audiences, or a site that depends on a few regular visitors.
What to do: A flat line isn't a problem, but it is a prompt to look for growth levers. Review which pages hold attention and which sources send visitors, then put your next effort into the strongest one.
How to use these patterns
You don't need to memorize the list. Ask three questions whenever something changes on your dashboard:
Where are they coming from? Check the referrer or source.
What are they looking at? Check the active page.
What are they using? Check the device and location.
These three answers explain most movements in live traffic. Once you know the cause, the right action is usually clear: improve the page, thank the source, fix the problem, or simply watch and learn.
Make it a habit
Real-time analytics is most valuable when you check it at the moments that matter: right after publishing, during a campaign, and after any change to your site. Over time you will learn what "normal" looks like for your website, and unusual activity will stand out immediately.
If you'd like to watch your own traffic as it happens, you can create a free LIVELOG account and get your tracking code in minutes.