2026-09-30 · 5 min read
What Is Website Analytics? A Plain-English Guide for Beginners
New to website analytics? Learn what it is, which data it collects, why it matters, and how to start using it to understand and grow your website.
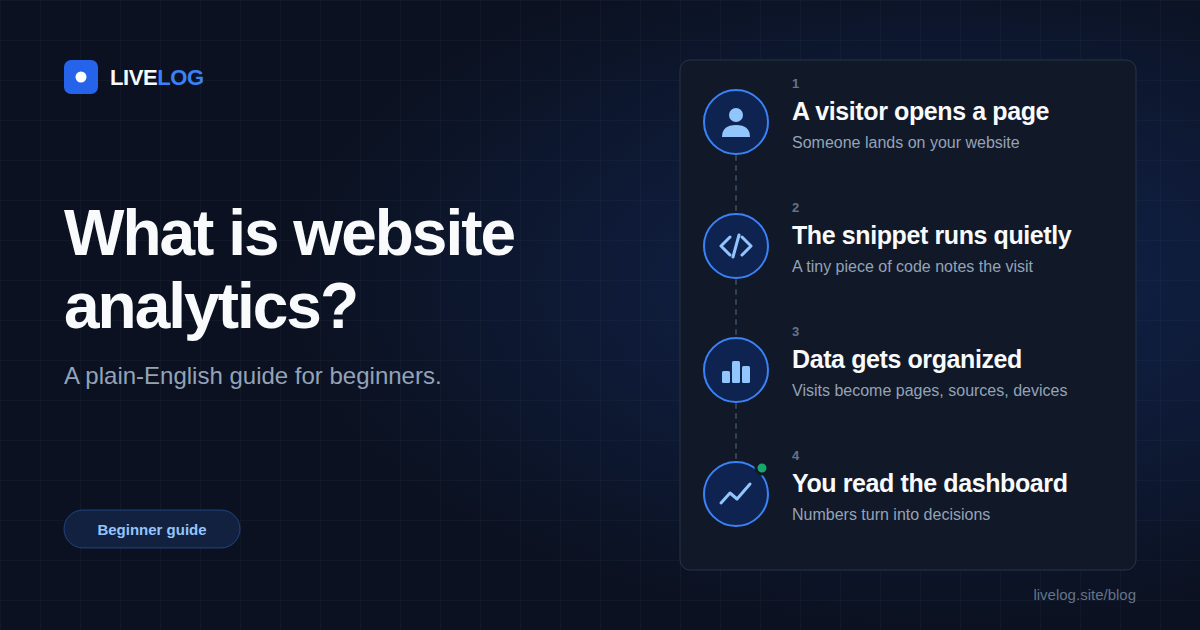
How Does Website Analytics Work?
When someone opens a page on your website, a small amount of tracking code quietly notifies a few fundamentals, such as which page they viewed, roughly where they came from, and what device they were using.
A single visit reveals almost nothing. After counting and sorting a few thousand of them, patterns begin to emerge. You can see which pages people like, which websites bring people to your site, and when your audience is engaged most.
Take a look at a small shop. A door counter tells you how many people walked in, and a clipboard notes which shelves they browsed and how they found the place.
Analytics takes care of your website's two aspects.
What data does it collect?
The majority of tools cover the same ground, but it depends on the tool and how you set it up. They count pageviews, or the total number of times your pages were viewed, as well as visitors (some of whom are split between new and returning visitors). They display the pages that are read the most frequently and from where, such as from a search engine, a social platform, another website, or directly from someone typing in your address. You'll also usually see a general location like country or region, the device and browser, the days and hours when traffic peaks, and how people move around your site and how long they stay.
You don't need everything right away. To begin, there are numerous visitors, popular pages, and traffic sources.
Why it matters
You can put your beliefs to the test. Just because you're proud of it makes it easy to believe that your most recent post is popular. Analytics allows for checking. You might find that an older, quieter article brings in most of your readers, and that tells you where your time is best spent.
You find out what your audience wants. If readers keep returning to a subject, write more about it. If a page you slaved over barely gets visits, you can improve it, link to it from elsewhere, or promote it differently.
You catch problems early. A sudden drop in visitors could be due to a broken page, a change that hurts your search visibility, or a dead link. Spot it today and you can fix it today, instead of discovering it weeks later.
You can put your promotion effort where it pays. You should focus more of your efforts on a single platform or community that sends readers who actually stay and engage.
You can measure your goals. Analytics gives you numbers against which to measure progress, whether you want more readers, more signups, or just a clearer picture of who comes to your site.
Historical versus real-time analytics
Analyses of the past look backward. It answers questions like how this month compares with last month, so it's the right tool for long-term trends.
Real-time analytics is useful for launches, campaigns, and sudden spikes or dips because it shows who is currently on your website and which pages they are viewing. The majority of site owners use both.
Want more detail? Read our guide to real-time vs historical analytics, and see how live data is read in 7 live traffic patterns and what they mean.
How it works
You don't have to be a developer to follow the short procedure.
Your website will get a small tracking snippet, usually in the header of each page. Only once does this occur.
When someone opens a page, the snippet runs quietly in their browser and sends basic details about the visit to your analytics tool.
These visits are sorted into reports and charts by the tool.
You open your dashboard and read the results: visitors, pages, sources and more.
After setup, nearly all of it runs on its own.
Common beginner mistakes
completing daily updates to the dashboard. Watching the numbers is just a waste of time if you don't have a question in mind. Decide what you want to learn first, like which article gets the most readers, and look for that.
focusing on the number of visitors. It's the number that everyone watches, but a large number won't tell you if the right people are there or what they do next. Check your pages and sources too.
wailing because of a quiet day. On a small site, daily numbers bounce around a lot. Read trends over weeks, not single days.
Ignoring privacy. If you collect visitor data, describe it in your privacy policy and adhere to audience-specific guidelines. Collect only what you need.
Observing without participating. Data changes nothing until you do something with it. After each check, pick one small action, like improving a page or sharing a popular article again.
How to get started
Choose a device that suits your needs. Simple ones are usually easier to learn than feature-heavy ones.
Follow the instructions provided by the tool to install the tracking snippet. Give it some time. Reports take a while to become meaningful.
Start with three questions: how many people visit, which pages they read, and where they come from.
It's a good idea to check in once a week and twice after you publish something. That's enough for most sites.
Change one thing at a time and watch what happens.
If you'd like to watch visitors as they arrive, you can create a free LIVELOG account, add your website and copy your tracking code in a few minutes.
Once the basics make sense, our guide to bounce rate, sessions and pageviews explains what each number means, and our guide to reading your traffic sources shows you where your visitors come from.